These are part of a series of analytical articles that I plan to write, focusing on analyzing and building models of Earth’s changing weather.
Solar Irradiance and Earth’s Energy Balance#
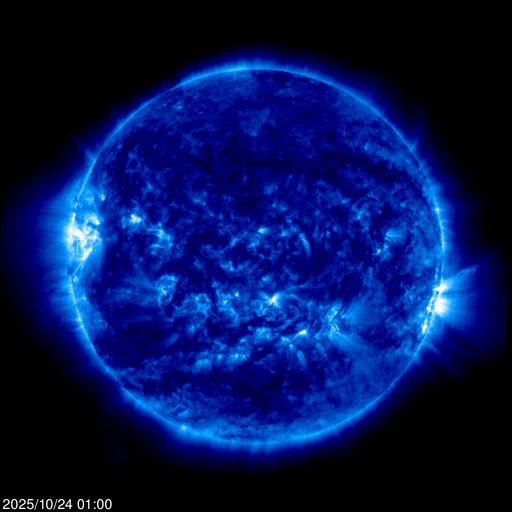
Image from SOHO channel showing the solar corona at about 1 million Kelvin. Active regions and coronal loops are visible, providing context for current solar activity. Picture of sun dated 24-10-2025
To understand Earth’s energy balance and monitor the heating effects of global warming, we need to know how much solar radiation reaches the planet. Solar irradiance is the amount of energy the Sun emits that arrives at the top of Earth’s atmosphere. Fortunately, this is a well-defined metric called Total Solar Irradiance (TSI). It is measured in watts per square meter (W/m²) and represents the total solar power falling on one square meter of area outside Earth’s atmosphere. TSI fluctuates slightly over time due to the 11-year solar cycle, which is part of a larger 22-year full magnetic cycle during which sunspot activity increases and decreases. The 11-year period comes from the interplay between: The rate of differential rotation (which builds magnetic stress), and the turbulent diffusion and meridional plasma flow (which redistribute magnetic stress). We are currently in Solar Cycle 25, and this year has marked the highest peak of this cycle.
Here are the solar cycles I took into account for this analysis.
cycles = [
    {"n": 22, "start": "1986-09-01", "max": "1989-07-01", "end": "1996-05-01"},
    {"n": 23, "start": "1996-05-01", "max": "2001-03-01", "end": "2008-12-01"},
    {"n": 24, "start": "2008-12-01", "max": "2014-04-01", "end": "2019-12-01"},
    {"n": 25, "start": "2019-12-01", "max": "2025-07-01", "end": "2030-01-01"},
]
The Solar and Heliospheric Observatory (SOHO) Archive provides access to the complete collection of solar observation data gathered since 1996. It includes measurements from all SOHO instruments, covering solar radiation, particle activity, and oscillations. Researchers can download full-mission datasets, ancillary data, and telemetry directly from the archive, which is continuously updated. The data is available at SOHO data
However, due to a flood in 2024, an emergency page with additional resources was established:
Data resources
As a temporary alternative, I used the VIRGO TSI dataset, Total Solar Irradiance, TSI, PMO6v8, PMO6, VIRGO, SOHO available here:
3532-1_VIRGO_TSI_Minute_Hourly_Daily_V8_20240926.zip
This dataset covers the period from 1996 to 2024.
Solar Observations#
Here is TSI visualized:
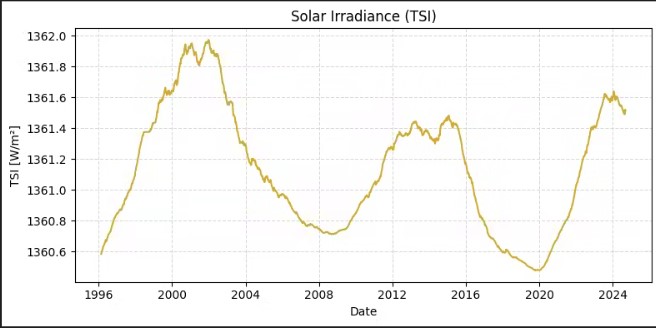
Raw Total Solar Irradiance (TSI) data from VIRGO version V8 (2024-09-26). Represents the incoming solar energy per square meter at the top of Earth’s atmosphere. Terms to observe:
- Solar maximum: Many sunspots, strong magnetic activity, frequent flares.
- Solar minimum: Few sunspots and reduced magnetic disturbances.
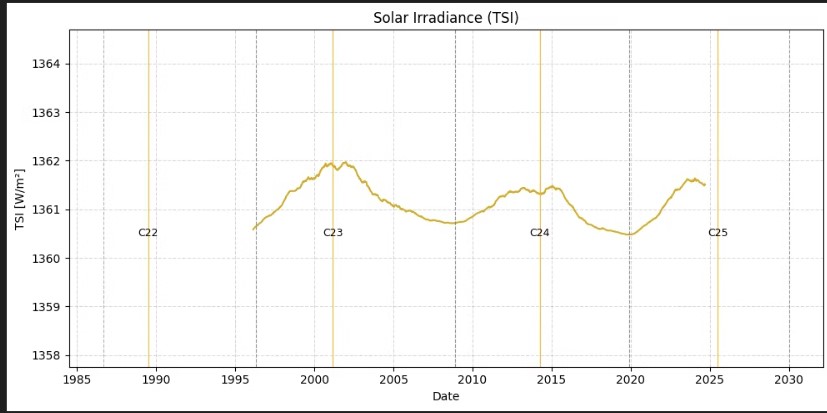
Smoothed TSI record with solar cycles 22–25 marked. Orange lines indicate cycle maxima; gray dashed lines mark the start and end of each cycle. Cycle numbers are shown on the timeline.
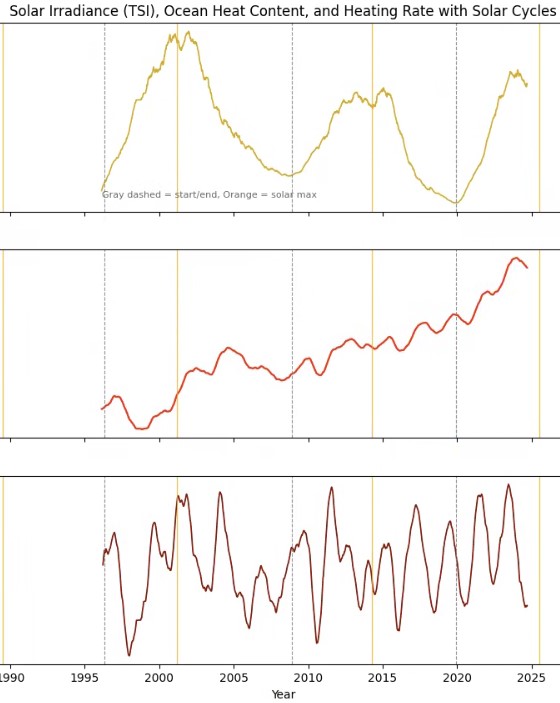
Modeling Ocean Heat Content#
Preliminary work on modeling the relationship between solar irradiance and ocean heat content.
The objective is to simulate and estimate oceanic heat accumulation through the remainder of Solar Cycle 25, expected to extend to around 2030.
Mechanism of Solar cycles and terms#
The solar cycle arises from a feedback loop driven by plasma motion inside the Sun. The feedback loop consists of:
- Differential rotation: The Sun doesn’t rotate as a solid body: the equator spins faster (~25 days) than the poles (~35 days). This motion stretches magnetic field lines, turning the poloidal (north–south) field into a toroidal (east–west) one.
- Convection: Hot plasma rises and cools in the convection zone, twisting and regenerating the magnetic field.
- Magnetic buoyancy and sunspot formation: Twisted toroidal magnetic fields become buoyant and rise through the surface, forming sunspot pairs with opposite magnetic polarity.
- Field reversal: Over time, these processes flip the Sun’s global magnetic polarity north becomes south and vice versa. This reversal occurs about every 11 years, so a full magnetic cycle lasts 22 years.